Can I teach a robot to replicate a line art
Raghav BV, Subham Kumar, Vinay P Namboodiri
(PDF) (arXiv) (code coming soon…)
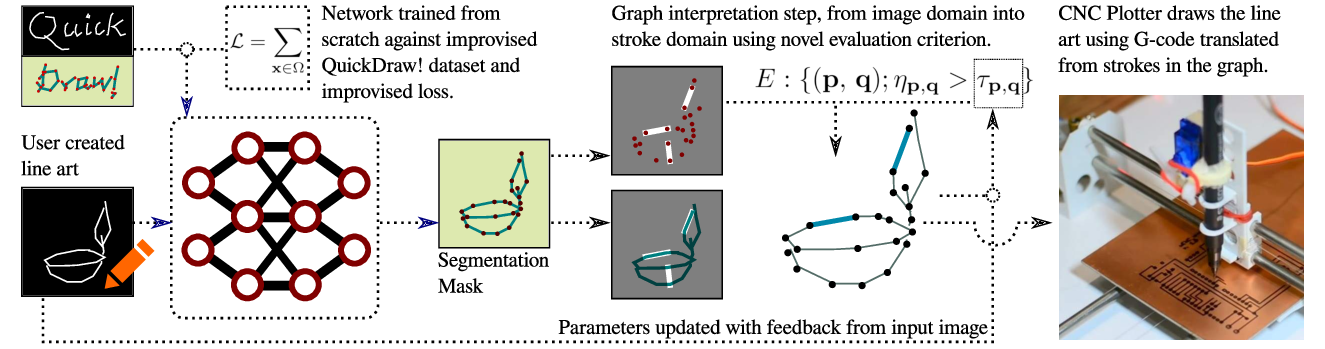
Figure 1: Left to Right. An artist drawing; digital copy of the drawing; segmented version; drawing by a CNC plotter.
- How to cite
@inproceedings{RKN19, title = {Can {I} teach a robot to replicate a line art}, booktitle = {2020 IEEE Winter Conference on Applications of Computer Vision (WACV)}, author = {Venkataramaiyer, Raghav B. and Kumar, Subham and Namboodiri, Vinay P}, year = {2020}, pages = {1922-1930}, doi = {} }
- Abstract
Line art is arguably one of the fundamental and versatile modes of expression. We propose a pipeline for a robot to look at a grayscale line art and redraw it. The key novel elements of our pipeline are: a) we propose a novel task of mimicking line drawings, b) to solve the pipeline we modify the Quick-draw dataset to obtain supervised training for converting a line drawing into a series of strokes c) we propose a multi-stage segmentation and graph interpretation pipeline for solving the problem. The resultant method has also been deployed on a CNC plotter as well as a robotic arm. We have trained several variations of the proposed methods and evaluate these on a dataset obtained from Quick-draw. Through the best methods we observe an accuracy of around 98% for this task, which is a significant improvement over the baseline architecture we adapted from. This therefore allows for deployment of the method on robots for replicating line art in a reliable manner. We also show that while the rule-based vectorization methods do suffice for simple drawings, it fails for more complicated sketches, unlike our method which generalizes well to more complicated distributions.
- The Network Architecture
We reinterpret the U-Net architecture with modular blocks for downsampling, upsampling and bottom, as a 4-tuple \((k_1\, k_2\, r\, d)\) for easy parameterization and architecture search.
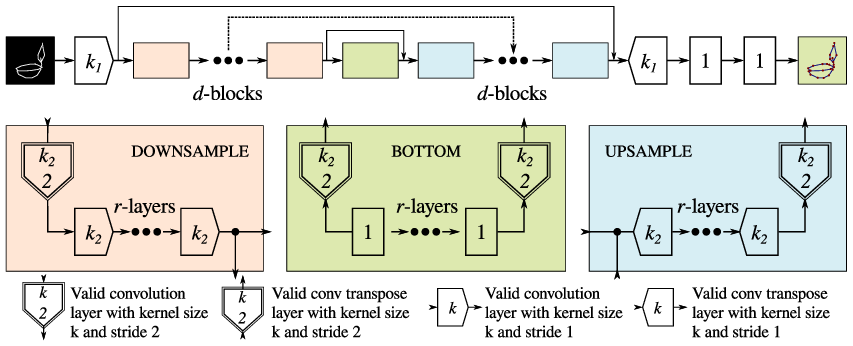
Figure 2: Reinterpretation of the U-Net architecture.
- Dataset
We take the Quick-draw dataset and synthesise the input as sketches, and output as their segmentation mask.
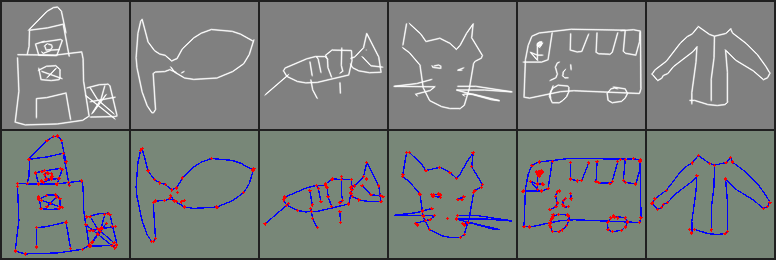
Figure 3: Top. Samples from the Quick-draw dataset; Bottom. Rendered true labels.
- Qualitative Results
Here is a list of qualitative results. First we compare the quality of our segmentation model against a popular vectorization method.
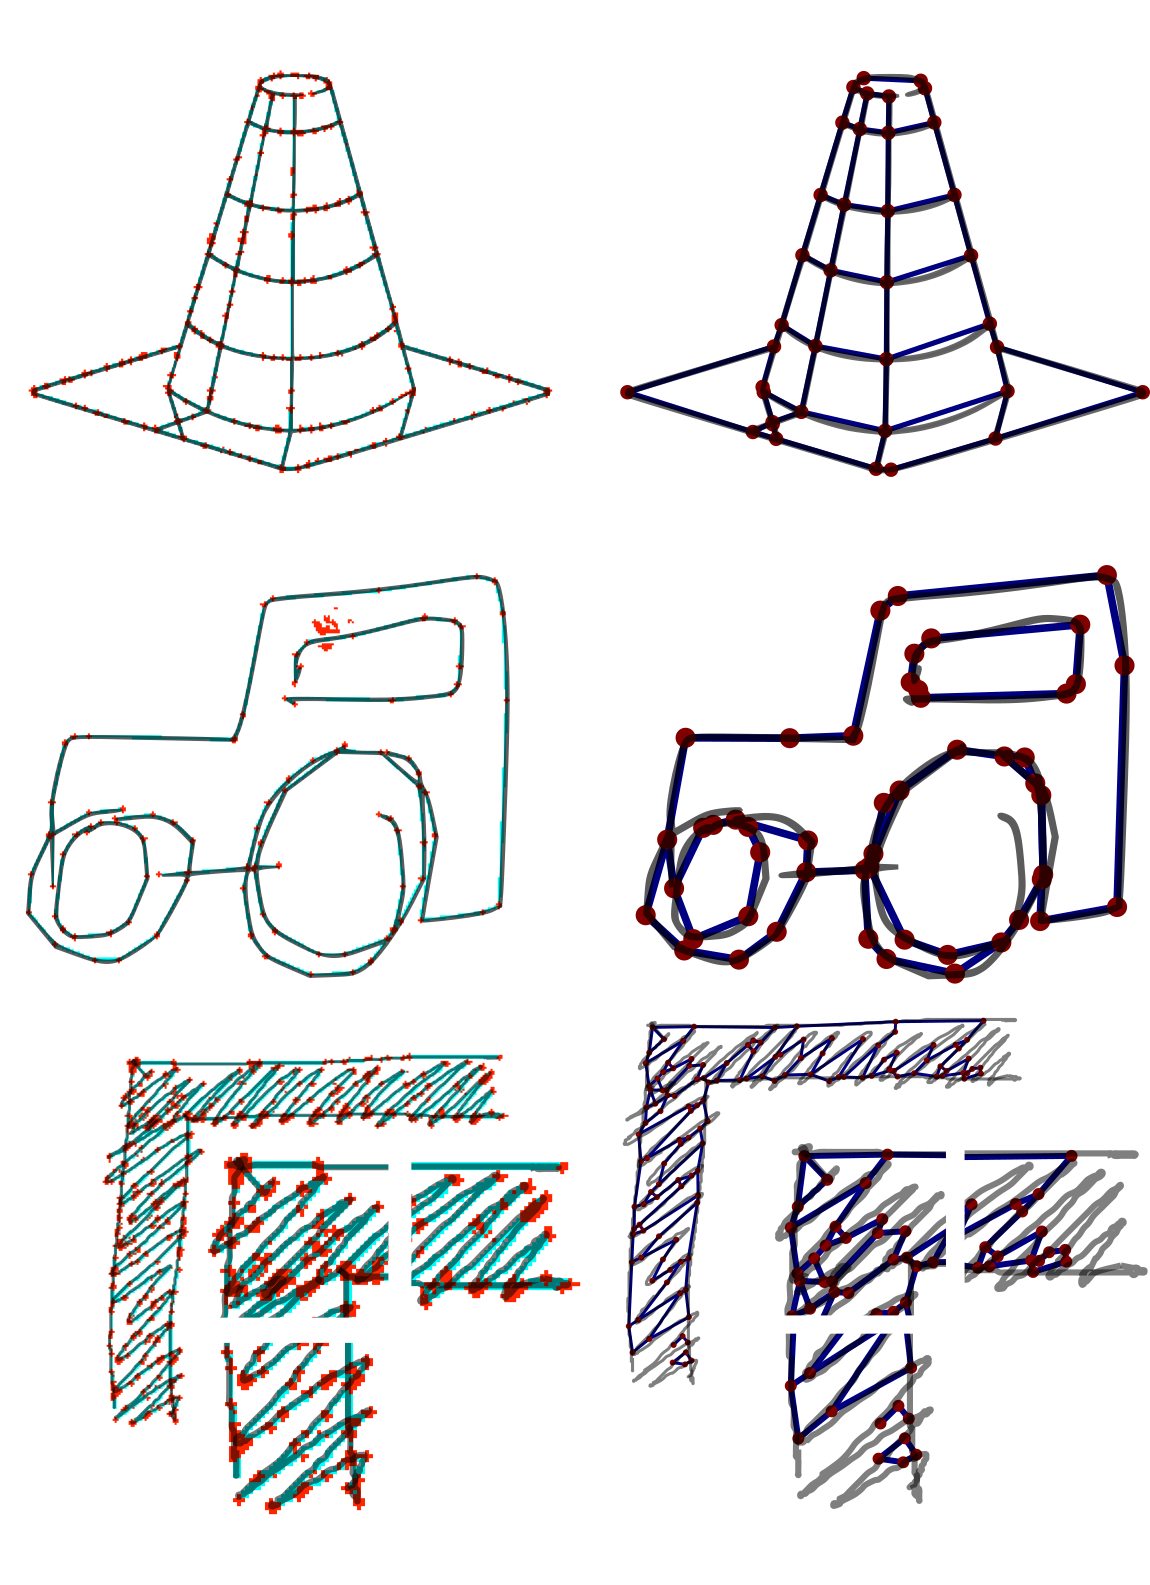
Figure 4: Comparison of our segmentation (left column) against Favreau’s vectorization (right column). Top to Bottom. A simple line sketch from Favreau’s examples; A simple line sketch from Quick-draw dataset; A complicated hatch pattern with zoomed in details.
Then we show the results of two of our graph interpretation models. The former model uses a set of fixed global parameters, and the latter updates parameters for every edge using feedback from comparison with the input image.
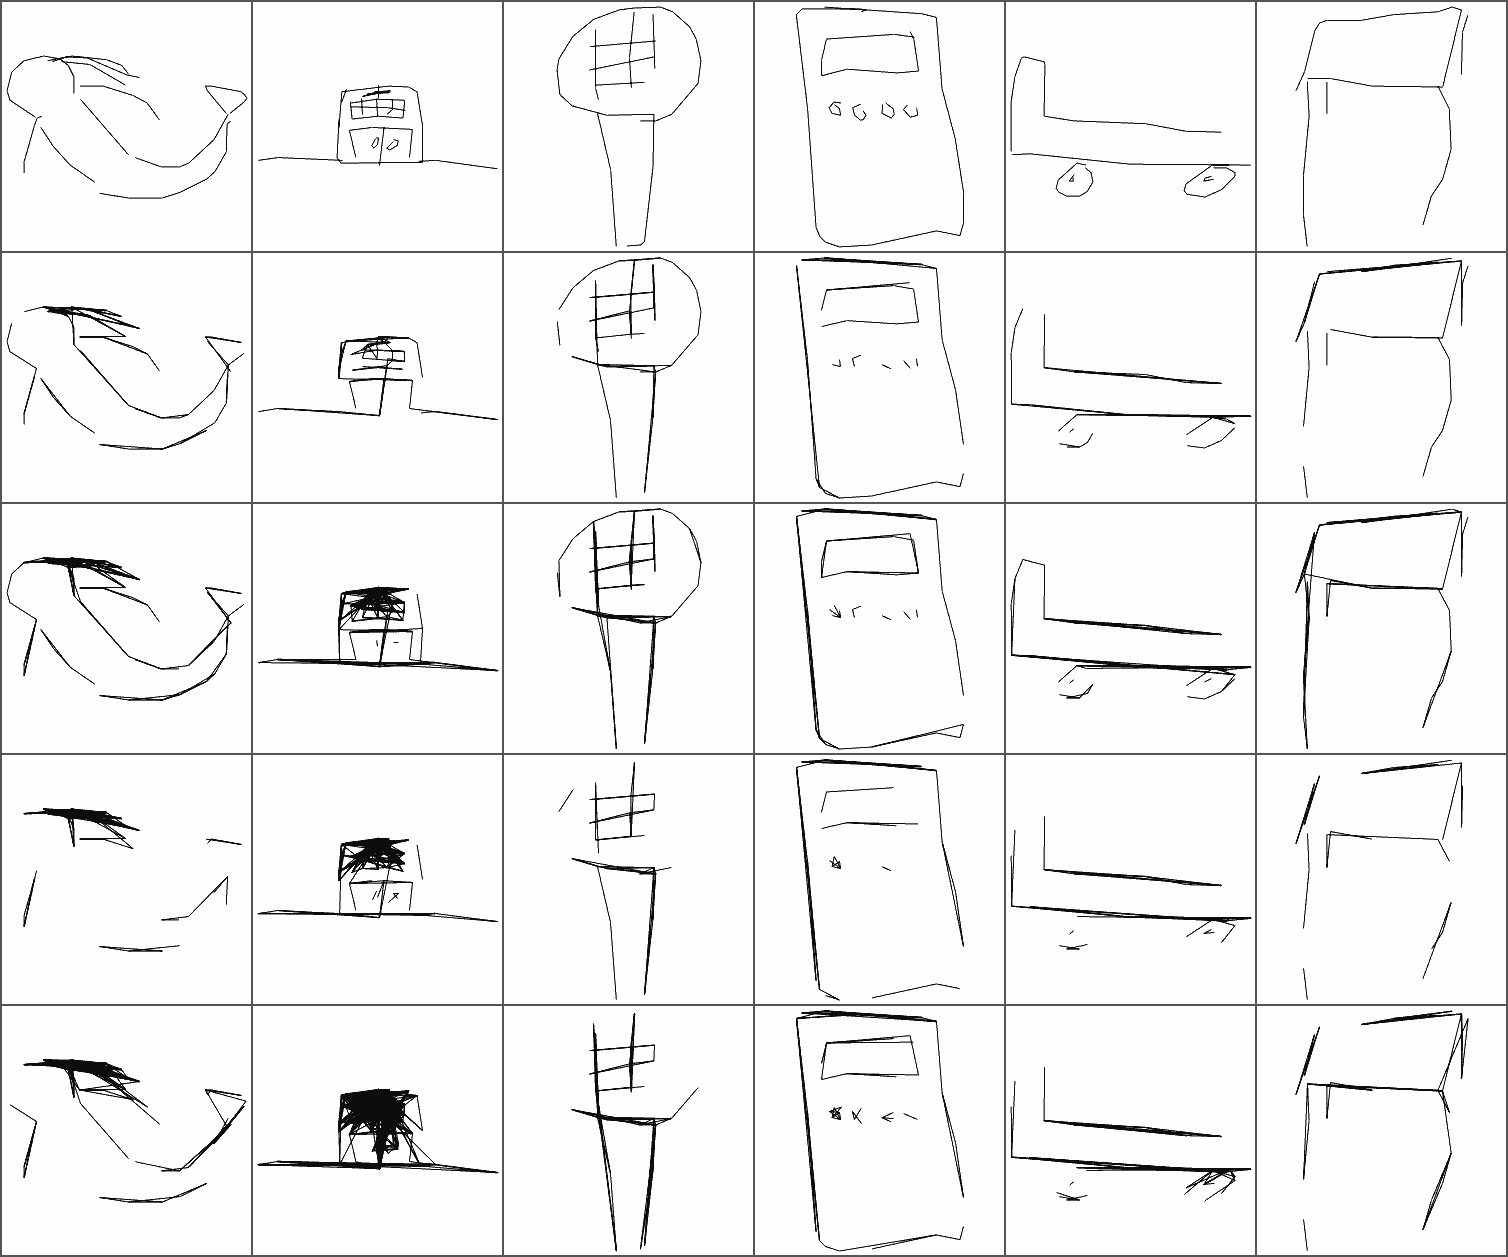
Figure 5: The top row shows the input. The subsequent rows show reconstruction using a graph interpreted from segmentation mask, with values of mask width and threshold \((\beta,\, \tau)\) set as \((2,\, 0.3)\), \((3,\, 0.22)\), \((5,\, 0.2)\), \((7,\, 0.15)\) respectively downwards.
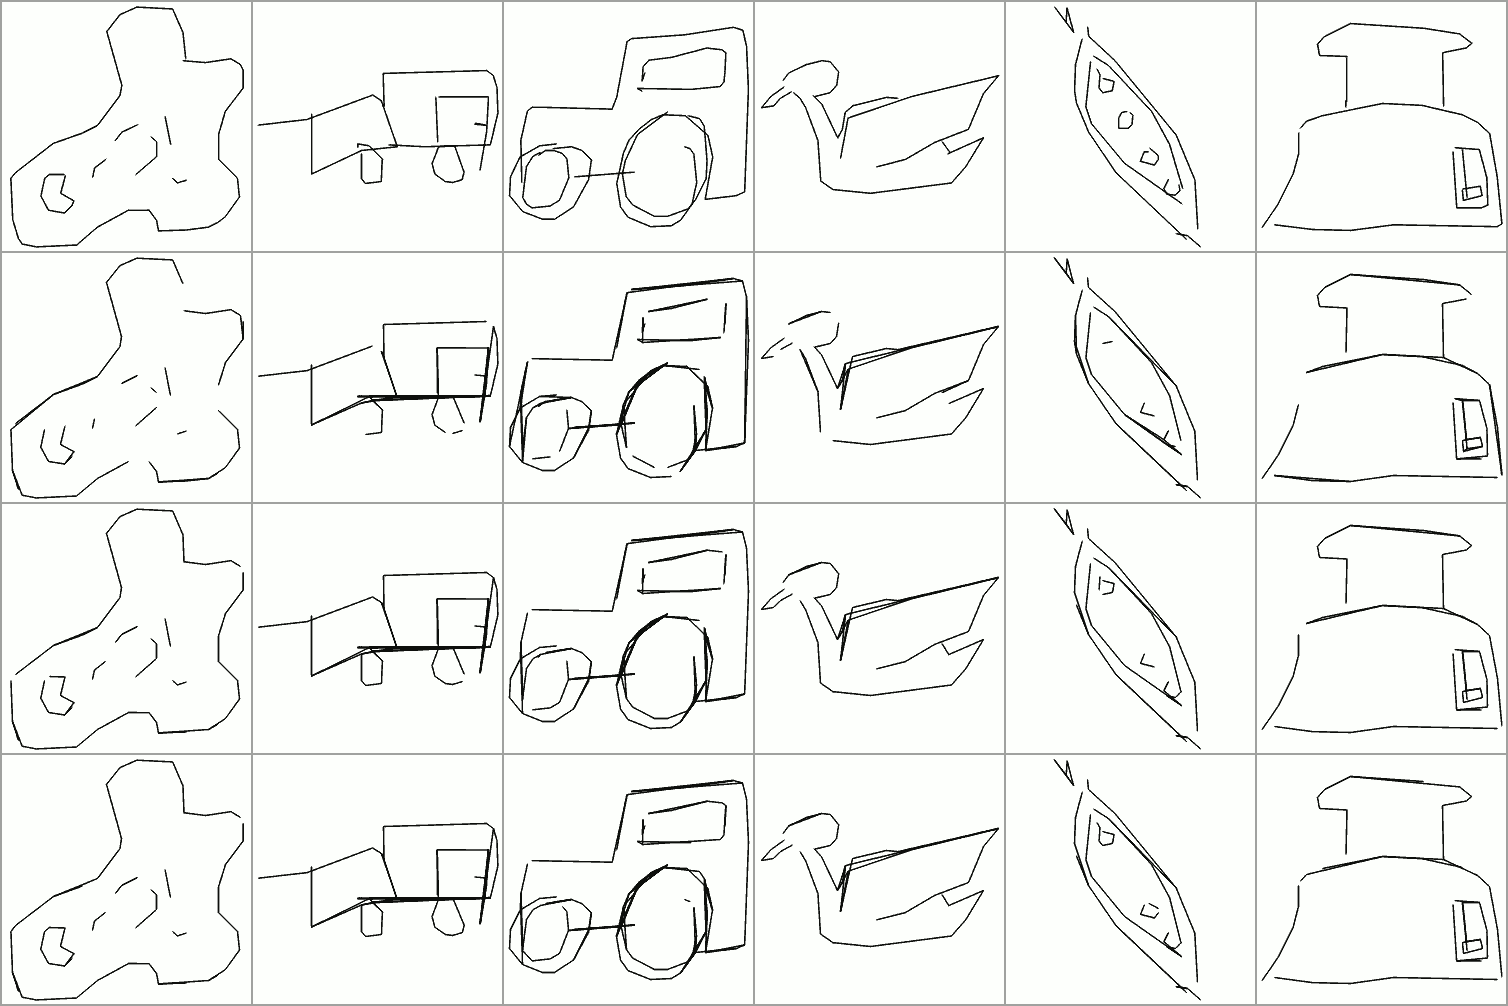
Figure 6: The results of feedback loop in graph interpretation. Rows top to bottom. the input image; naive graph interpretation; interpretation after \(N = 5\) updates; and after \(N = 10\) updates.